
Whether you’re on Windows, Android, or any device with a web browser, you’ve likely encountered the somewhat mysterious “developer tools” screen at some point.
The interface of Chrome’s DevTools, with its panels teeming with technical settings, can be a daunting sight. It’s like walking into a labyrinth if you’re not a programmer.
You might be tempted to close that tab as quickly as possible to get away from alllllll the overwhelming options.
But don’t panic!
Developer tools don’t have to be just for developers. With just a bit of guidance, Google Chrome’s built-in developer tools and debugging tools can be useful for almost any internet user.
This post explains what Chrome developer tools are, breaks down the different panels and settings, and gives tips for using the tools to improve your browsing experience.
You’ll learn handy tricks like:
- Monitoring network requests to speed up page load times
- Inspecting and editing page elements on the fly
- Debugging errors and issues with pages
So next time you accidentally stumble into the developer tools interface in your Chrome browser, don’t close it immediately!
With the right mindset and a few pointers, you can unlock all sorts of capabilities for improving your everyday web browsing.
Regardless of your technical expertise.
Let’s dive in!
Table of contents
- Chrome developer tools 101
- 6 DevTools superpowers for web designers
- 10 pro tips for DevTools domination
Chrome developer tools 101
Tired of flying blind when designing, developing, or debugging web pages? Google Chrome has your back with its built-in superpowers – the Chrome DevTools.
Think of DevTools as the ultimate multi-purpose toolkit for taking control of your web projects. With these powerful yet easy-to-use tools, you can poke, prod, and customize web pages right from your browser. Plus, you get to see your edits take effect in real time – no waiting around required.
So whether you’re a designer needing to perfect layouts and animations, a developer debugging code, or really anyone who wants precise command of web pages, DevTools is your new bestie.
How to access developer tools on Chrome
Finding Chrome’s hidden magic is simple:
Click the three-dot menu in the top right corner of Chrome. Then click More tools > Developer tools.
Or, right-click anywhere on the web page you want to customize, then click Inspect.
For all you impatient wizards, there’s a handy shortcut to access Chrome’s sorcery:
- Windows/Linux: Press CTRL+Shift+C
- Mac: Press CMD+Option+C
Bam! The magical DevTools window appears. ✨
Now, to unlock these devtools’ full power, wave hello to the main tabs:
- Elements: X-ray vision to see the HTML and CSS code behind the curtain.
- Console: A chatroom for the website to share updates. You can also write JavaScript to make changes to the webpage.
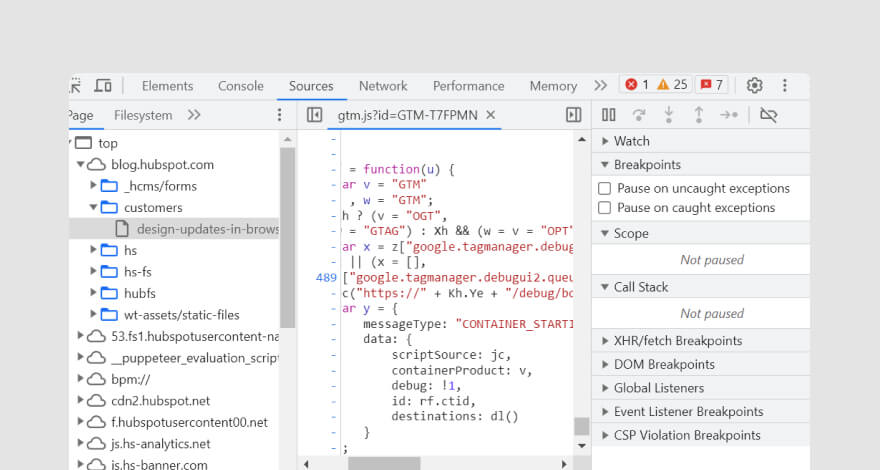
- Sources: The filing cabinet for the site’s behind-the-scenes files.
- Network: Shows all the files needed to load the page.
- Performance: The site’s digital personal trainer giving you a report of the page load time.
- Memory: For investigating memory distribution on the web page.
- Application: Find stored browser secrets here.
- Security: The site’s bodyguard showing security deets and flashing the server’s certificate.
6 DevTools superpowers for web designers
As a web designer, your job goes way beyond just making pretty websites. To work your magic, you need to understand how all the behind-the-scenes code comes together to create the final user experience.
DevTools allows you to x-ray view sites to spot and fix errors before they ruin the magic. 🪄
Here’s how.
DevTools superpower #1: View live web pages in different dimensions
One of the handiest design superpowers is shape-shifting sites to preview different dimensions. Wanna view that responsive site on multiple devices? DevTools lets you instantly morph to different screen sizes and orientations with a snap.
No more tedious manual resizing or guessing how it’ll look. Just use these commands:
- Windows/Linux: CTRL + Shift + I (open DevTools) then CTRL + Shift + M
- Mac: CMD + Shift + I then CMD + Shift + M
Or right-click the page and select Inspect to summon DevTools, then click the mobile icon.
You can even simulate weak network connections to preview loading behavior.
Go to the Custom menu, select any of the options in the dropdown, and refresh the page after selecting a throttle value.
DevTools superpower #2: Chameleon color changes
Changing up a website’s colors for some moodboard magic? DevTools lets you instantly preview different color schemes on live sites.
Just summon the DevTools window, select any element you want to recolor, and a handy color picker appears for all your design needs.
Switch up those colors and watch the site transform before your eyes!
DevTools superpower #3: Lightning-fast screenshots
DevTools also makes easy work of capturing screenshots. Want feedback on a specific design element? Need to collaborate with your team? Just use these commands:
- Windows/Linux: CTRL + Shift + C, then CTRL + Shift + P
- Mac: CMD + Shift + C, then CMD + Shift + P
Type “screenshot” and capture any part of the page you want!
And for seamless sharing and feedback, send those DevTools screenshots directly into MarkUp.io.
Our collaboration tools help teams work visual magic faster. 💫
DevTools superpower #4: Page speed sorcery 🧙
Want to check how fast it takes your mobile or web application to load? DevTools to the rescue!
You can easily measure page load times right within DevTools. You can also check accessibility, SEO, and more.
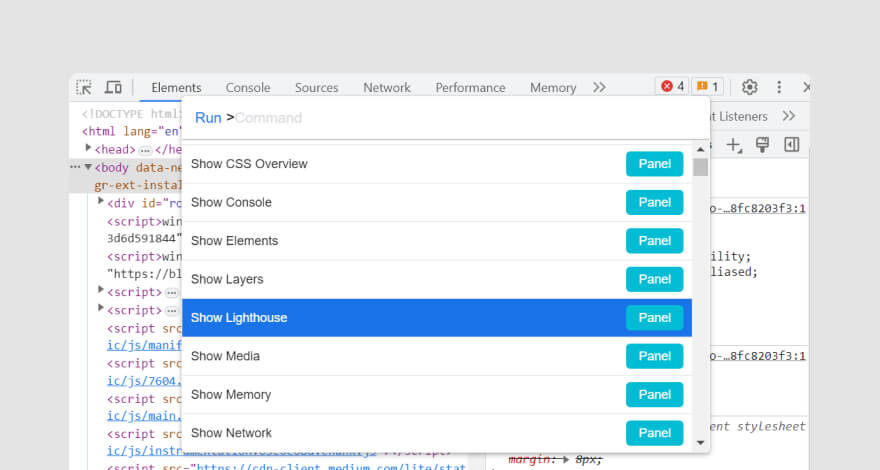
Just summon the DevTools window and click the Lighthouse button.
You’ll get several categories to explore such as Best Practices, SEO, Performance, Accessibility, and more.
Select Performance to see your site’s Speed Index. 0-4.3 seconds is fast, 4.4-5.8 is moderate, and over 5.8 is slow.
But the real magic comes after – Lighthouse also gives you a list of “Opportunities” to speed up load time. It’s like a digital assistant for optimization!
DevTools superpower #5: Spying on analytics
Keep an eagle 👁 on your Google Analytics data with DevTools!
Want to double check those marketing campaign numbers? Verify your stats are accurate? DevTools lets you sneak a peek behind the scenes.
Just:
- Open the Network panel in DevTools
- Load your page
- Click 3rd-party requests
- Find requests from GA (utm.gif)
- Click to see all the deets requested
DevTools superpower #6: Peek into design details
The Inspect tool in DevTools lets you x-ray view changes made to any element. Just hover over something on the page to see all the design deets!
This gives you super vision into CSS changes, properties, and more. Never wonder “what did the developer change?” again!
DevTools tips the design details right into your hands. Take that, tedious guesswork!
***
Okay, so you’ve seen the magical design superpowers Chrome DevTools can grant you. But to take your skills from novice to master wizard, you need…
…drumroll please. 🥁
…Pro tips and tricks for DevTools domination! Keep scrolling.
10 pro tips for DevTools domination
Still trying to navigate the labyrinth of DevTools? Rest assured, you’re not alone. From nifty keyboard shortcuts to simple hacks within the DevTool window, a wealth of knowledge is waiting to be tapped into. Let’s dive into some top tips to supercharge your productivity:
Tip #1: Open the command menu
Think of the command menu as your personal concierge. It’s ready and waiting to execute a myriad of commands, saving you from endless clicking.
To open the DevTools window, simply press CTRL (or CMD)+Shift+I, then CTRL (or CMD)+Shift+P to launch the command menu.
Here, you can run a plethora of commands—from capturing screenshots to tweaking colors, and beyond. ✨
Tip #2: Search source codes
Struggling to locate specific source codes? Well, here’s a shortcut just for you.
Type CTRL+Shift+F or CMD+Opt+F to summon the search bar within the DevTools window.
Whether you’re hunting for <bootstrap> or something entirely different, the answer is now just a click away.
Tip #3: Go full ‘design mode’
Ever wished you could effortlessly edit text on your website to preview potential layout changes? Well, with ‘Design Mode,’ you can!
Simply navigate to the console tab on DevTools. Type in document.designMode=”on,” and hit enter.
Voila! You’re now in control.
Tip #4: Change document structure
Caught without access to a site’s source file but need to make changes?
No problem! You can copy and paste elements, effectively rearranging the structure as you see fit. It’s as simple as it sounds. 👌
Tip #5: Embrace the dark side with dark mode
Feeling a more Goth aesthetic for your DevTools window? You can easily switch from light to dark mode. Just head over to Settings at the top-right corner of the window. Then navigate to Appearance > Theme > Dark.
Voila! Your DevTools now has a sleek new look. 💅
Tip #6: DevTools position
The DevTools window appears to the right of your browser by default, but it doesn’t need to stay that way.
Click the three dots located on the right side of the window. In the ensuing menu, you’ll spot the dockside showing an alternate position. Choose your desired position, and presto! You can get back to your tasks.
Tip #7: Master the multi-cursor
Let’s assume you’re familiar with Javascript code and need to edit identical elements across multiple lines.
Rather than lose the next ten years of your life to repetitive copy-pasting, try this shortcut. 👇
Press CTRL on your keyboard and click on the areas you want to change. This way, you can update the main line and see those changes mirrored on the others in real time.
Tip #8: Console workspace shortcuts
Wanna work your coding magic across several lines? No biggie!
Hit Shift+Enter to write code snippets. To execute, tap Enter.
To clear the console for more coding, press CTRL+L for Windows or CMD+L for fancy Mac users. 🙃
Tip #9: Sources workspace shortcuts
Passing time in the Sources tab? Give these keyword shortcuts a shot:
- Press CMD (CTRL) + O to reveal loaded files.
- For a peek into file properties, type CMD (CTRL) + Shift + O.
Tip #10: The Watchlist
Debugging a site?
Add frequently used variables or expressions to the Watch list in the source tab for easy access.
Boom! No more repetitive writing or copy-pasting! 🎉
***
You made it to the end! Now isn’t that just wonderful? ☺️
But don’t stop exploring just yet. There’s a little more to uncover.
Your turn
If you’re new to Chrome’s DevTools, remember that every master was once a beginner.
It might seem overwhelming now, but with time and the right collaborative efforts, you’ll develop an invaluable skill set in no time.
See, collaboration is where the real magic happens.
Ever thought about working with others on a live website? Well, that’s where MarkUp.io steps into the spotlight.
Our Chrome extension lets you collaborate on live websites in real time – super useful for tracking changes and keeping everyone on the same page.
Think of MarkUp.io as your passport to a world of seamless design collaboration. After all, it’s trusted by leading designers and creatives as a platform to gather feedback in the least annoying way possible.
Sign up for a free 30-day trial with MarkUp.io and start taking your time back.